- Filtering instances in CoCreate Modeling (08 Dec 2017)
- Expanding drawlists (14 Nov 2017)
- Restoring OneNote data from the local cache (08 Oct 2017)
- macOS Sierra auf meinem Macbook Pro (21 Oct 2016)
- CoCreate Modeling: Wie startet man ein interaktives cmd.exe? (05 Jul 2016)
- Projekt Umstieg (02 Jul 2016)
- A poor man's Common Lisp profiler (08 Mar 2016)
- A poor man's Common Lisp profiler (08 Mar 2016)
- CoCreate Modeling: Changing the current directory during startup (02 Nov 2015)
- Older topics...
Filtering instances in CoCreate Modeling (08 Dec 2017)
oli:sd-inq-obj-contents-sysid. The following code uses content sysids as the keys
for a hash table. The unique-objects function returns the filtered list, i.e. a list which contains
only one representative for any given number of shared instances.
(in-package :de.clausbrod.filterinstances)
(use-package :oli)

(defun unique-objects(objects)
  (let ((ht (make-hash-table :test 'equal)))
    (dolist (obj objects)
      (setf (gethash (oli:sd-inq-obj-contents-sysid obj) ht) obj))
    (loop for obj being the hash-values of ht collect obj)))
Expanding drawlists (14 Nov 2017)
sd-inq-vp-drawlist-objects which returns a list of all
currently visible objects.
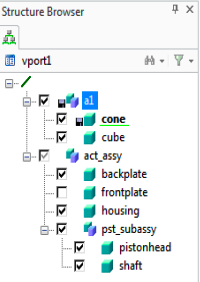
- Assembly "a1"
- Part "cone" in assembly "a1"
- Part "cube" in assembly "a1"
- Part "backplate" in assembly "act_assy"
- Part "housing" in assembly "act_assy"
- Part "pistonhead" in assembly "act_assy/pst_subassy"
- Part "shaft" in assembly "act_assy/pst_subassy"
sd-inq-vp-drawlist-objects "compresses" its result as follows:
- If all objects below an assembly are checked (=visible), only the assembly is returned
- In partially visible assemblies, visible objects are returned individually
sd-inq-vp-drawlist-objects would return a list containing:
- /a1
- /act_assy/backplate
- /act_assy/housing
- /act_assy/pst_subassy
- /a1/cone
- /a1/cube
- /act_assy/backplate
- /act_assy/housing
- /act_assy/pst_subassy/piston-head
- /act_assy/pst_subassy/shaft
(in-package :de.clausbrod.expanddrawlist)
(use-package :oli)

(defun flatten-assembly-mapcan(node)
  (cons node
   (mapcan #'flatten-assembly-mapcan (sd-inq-obj-children node))))

(defun expand-objects(objects)
  (loop for obj in objects
   nconc (remove-if-not #'sd-inq-part-p (flatten-assembly-mapcan obj))))

(defun show-part(p)
  (display (sd-inq-obj-pathname p)))

(let ((displayed-objects (sd-inq-vp-drawlist-objects (sd-inq-current-vp))))
  (mapc #'show-part (expand-objects displayed-objects)))
(in-package :de.clausbrod.expanddrawlist)
(use-package :oli)

(defun show-part(p)
  (display (sd-inq-obj-pathname p)))

(defun visit-parts(obj)
  (if (sd-inq-part-p obj)
      (show-part obj)
    (mapc #'visit-parts (sd-inq-obj-children obj))))

(let ((displayed-objects (sd-inq-vp-drawlist-objects (sd-inq-current-vp))))
  (mapc #'visit-parts displayed-objects)))
Restoring OneNote data from the local cache (08 Oct 2017)
%LOCALAPPDATA%\Microsoft\OneNote\16.0, but it had not deleted the old OneNote 2013 cache (below
%LOCALAPPDATA%\Microsoft\OneNote\15.0), and this saved my bacon.
Others have fallen into the same or similar traps before, of course, and so there are a number of related
discussions out there on the topic, for example at https://answers.microsoft.com/en-us/msoffice/forum/msoffice_onenote-mso_other-mso_2010/recover-information-from/8bf30713-316b-49cb-abc3-a8ce8e4b310d. A number of approaches are mentioned, such as:
- Restore OneNote sections from the
C:\Users\<name>\AppData\Local\Microsoft\OneNote\15.0\Backupdirectory- This worked only partially because the latest backup was already several days old.
- Extract notes from the old
OneNoteOfflineCache.onecachefile inC:\Users\<name>\AppData\Local\Microsoft\OneNote\15.0\by runningonenote.exe /forcerepairon it.- This would fail because both OneNote 2013 and OneNote 2016 would complain that the cache file was of a format written by a "future version" of OneNote. (Which wasn't true, because the local cache file was written by OneNote 2013.
- See also https://support.microsoft.com/en-us/help/825779/how-to-recover-information-in-a-damaged-onenote-section-file
- I installed OneNote 2013 on a separate Windows VM.
- Then I copied over the cache files from my developer laptop to the Windows VM, i.e. both the
OneNoteOfflineCache.onecachefile and theOneNoteOfflineCache_Filesdirectory (which holds all the attachments), overwriting the default local cache files of the OneNote 2013 installation on the VM. - After starting OneNote 2013 on the VM, it displayed all notes just fine. Big sigh of relief.
- Syncing those notes from the VM to the cloud would not work, though. I first had to move all the notes to a new section in the affected notebook, and then wait until all notes had been synced.
- And now, finally, the notes reappeared in my OneNote 2016 installation on my developer laptop as well.
macOS Sierra auf meinem Macbook Pro (21 Oct 2016)
Ausserdem musste ich feststellen, daß Paintbrush nicht mehr starten will. Offenbar gibt es dazu auch keine neuere Version, und so bin ich jetzt auf der Suche nach gleichwertigem oder besseren Ersatz. Nachtrag (1. Juni 2017): Nachdem ich heute Paintbrush testweise neu heruntergeladen habe, lief es scheinbar anstandslos, und das trotz macOS Sierra. Mindestens in diesem Punkt also Entwarnung.
CoCreate Modeling: Wie startet man ein interaktives cmd.exe? (05 Jul 2016)
(oli:sd-sys-exec "cmd.exe")zu versuchen. Das führt dann aber dazu, dass CoCreate Modeling scheinbar hängt und nichts Erkennbares passiert. cmd.exe ist ein Kommandozeilenprogramm. Deswegen ist es völlig normal, dass ("grafisch") nichts passiert, wenn man cmd.exe als externes Programm ohne Parameter startet, zum Beispiel per sd-sys-exec. Dann wartet cmd.exe nämlich einfach im Hintergrund auf weitere Eingaben und tut sonst nichts.
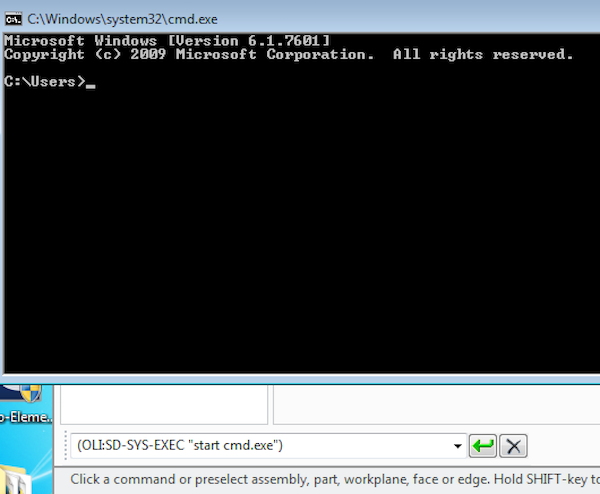
(oli:sd-sys-exec "start cmd.exe")(Zu den Kommandozeilenparametern und Besonderheiten des Helferleins
start siehe http://ss64.com/nt/start.html.)
Bonusfrage: Wenn cmd.exe ein Kommandozeilenprogramm ohne grafische Oberfläche ist, wieso öffnet sich denn ein Terminalfenster, wenn man cmd.exe aus Windows Explorer heraus startet?
Antwort: Weil Explorer entsprechend vorkonfiguriert ist - intern wird in so einem Fall nicht einfach nur cmd.exe ausgeführt, sondern das moralische Äquivalent zu start cmd.exe.
Bonusfrage 2: Woher weiss Windows eigentlich, wo cmd.exe liegt? Muss man da nicht einen Pfad wie C:\Windows\System32\cmd.exe angeben?
Hintergrund: In der Forumsfrage wurde ein solcher hartkodierter Pfad verwendet.
Antwort: Das Verzeichnis, in dem cmd.exe liegt, taucht im Inhalt der Umgebungsvariablen PATH auf, die Windows beim Starten von Programmen konsultiert. Damit ist die explizite Angabe eines Pfades unnötig. Mehr noch, sie ist sogar kontraproduktiv und fehlerträchtig - denn nicht auf jedem Rechner liegt das Windows-Verzeichnis unter C:\Windows.
Bonusfrage 3: Wozu ist das eigentlich gut, so eine interaktive Instanz von cmd.exe aus einer CAD-Applikation heraus zu starten?
Kopfkratzende erste Antwort: Für sachdienliche Hinweise dankbar  Zweite Antwort nach Eintreffen der angeforderten sachdienlichen Hinweise: Ziel war es offenbar letztlich, ein kleines interaktives Kommandozeilenprogramm zu starten - der Start von
 cmd.exe war nur erster Test dafür.
Projekt Umstieg (02 Jul 2016)

A poor man's Common Lisp profiler (08 Mar 2016)
symbol-function.
There are other profilers out there for Common Lisp, but it is not always straightforward to make them work in CoCreate Modeling which implements a subset of CLtL1 only. So who knows, maybe someone out there will actually find this useful!(in-package :clausbrod.de) (export '(profile-function unprofile-function list-profiling-results)) (let ((profile-hashtable (make-hash-table))) (defun profile-function(func) "Instrument function for profiling" ;; check if symbol-plist already contains profiler flag (unless (get func :profile-original-symbol-function) (let ((original-symbol-function (symbol-function func))) (when original-symbol-function (setf (get func :profile-original-symbol-function) original-symbol-function) ;; mark as profiled ;; install profiler code (setf (symbol-function func) (lambda(&rest r) (let ((start-time (f2::seconds-since-1970))) (unwind-protect (if r (apply original-symbol-function r) (funcall original-symbol-function)) (let ((execution-time (- (f2::seconds-since-1970) start-time)) (accum (gethash func profile-hashtable))) (if accum (setf (gethash func profile-hashtable) (+ accum execution-time)) (setf (gethash func profile-hashtable) execution-time)) (format *standard-output* "~%Execution time for ~S: ~,10F~%" func execution-time)))))) )))) (defun unprofile-function(func) "Remove profiling instrumentation for function" (let ((original-symbol-function (get func :profile-original-symbol-function))) (when (remprop func :profile-original-symbol-function) (setf (symbol-function func) original-symbol-function)))) (defun list-profiling-results() "List profiling results in order of decreasing accumulated execution times" (format *standard-output* "~%Accumulated execution times:~%") (let (table-as-list) (maphash (lambda(k v) (push (cons k v) table-as-list)) profile-hashtable) (dolist (pair (sort table-as-list #'> :key #'cdr)) (format *standard-output* "~S: ~,10F~%" (car pair) (cdr pair))))) ) (f2::win-open-console-window) (setf si::*enter-break-handler* t) (use-fast-links nil)
To profile a function:
(clausbrod.de:profile-function 'my-function)Now execute
my-function at your heart's content. Every time the function is called, the profiler measures its execution time.
When the test session is completed, accumulated execution times can be listed as follows:
(clausbrod.de:list-profiling-results)And here is how to profile all functions in a given Lisp package:
  (do-external-symbols (s (find-package "FOO"))
    (when (function s)
      (clausbrod.de:profile-function s)))
My implementation differs almost entirely from Alex' version, which allows me to call it my own, but of course I owe thanks
to Alex for starting the discussion in the forum and posting his original inspirational code!
The code is now available as a Github project, see https://github.com/clausb/lisp-profiler. There is even a simple GUI
dialog on top of the low-level profiling code:
 The version of the code shown above uses a SolidDesigner-specific way of getting the current time in high precision. The improved
version in the Github project should work in other Lisp dialects as well. Fingers crossed.
The version of the code shown above uses a SolidDesigner-specific way of getting the current time in high precision. The improved
version in the Github project should work in other Lisp dialects as well. Fingers crossed.
A poor man's Common Lisp profiler (08 Mar 2016)
symbol-function.
There are other profilers out there for Common Lisp, but it is not always straightforward to make them work in CoCreate Modeling which implements a subset of CLtL1 only. So who knows, maybe someone out there will actually find this useful!(in-package :clausbrod.de) (export '(profile-function unprofile-function list-profiling-results)) (let ((profile-hashtable (make-hash-table))) (defun profile-function(func) "Instrument function for profiling" ;; check if symbol-plist already contains profiler flag (unless (get func :profile-original-symbol-function) (let ((original-symbol-function (symbol-function func))) (when original-symbol-function (setf (get func :profile-original-symbol-function) original-symbol-function) ;; mark as profiled ;; install profiler code (setf (symbol-function func) (lambda(&rest r) (let ((start-time (f2::seconds-since-1970))) (unwind-protect (if r (apply original-symbol-function r) (funcall original-symbol-function)) (let ((execution-time (- (f2::seconds-since-1970) start-time)) (accum (gethash func profile-hashtable))) (if accum (setf (gethash func profile-hashtable) (+ accum execution-time)) (setf (gethash func profile-hashtable) execution-time)) (format *standard-output* "~%Execution time for ~S: ~,10F~%" func execution-time)))))) )))) (defun unprofile-function(func) "Remove profiling instrumentation for function" (let ((original-symbol-function (get func :profile-original-symbol-function))) (when (remprop func :profile-original-symbol-function) (setf (symbol-function func) original-symbol-function)))) (defun list-profiling-results() "List profiling results in order of decreasing accumulated execution times" (format *standard-output* "~%Accumulated execution times:~%") (let (table-as-list) (maphash (lambda(k v) (push (cons k v) table-as-list)) profile-hashtable) (dolist (pair (sort table-as-list #'> :key #'cdr)) (format *standard-output* "~S: ~,10F~%" (car pair) (cdr pair))))) ) (f2::win-open-console-window) (setf si::*enter-break-handler* t) (use-fast-links nil)
To profile a function:
(clausbrod.de:profile-function 'my-function)Now execute
my-function at your heart's content. Every time the function is called, the profiler measures its execution time.
When the test session is completed, accumulated execution times can be listed as follows:
(clausbrod.de:list-profiling-results)And here is how to profile all functions in a given Lisp package:
  (do-external-symbols (s (find-package "FOO"))
    (when (function s)
      (clausbrod.de:profile-function s)))
My implementation differs almost entirely from Alex' version, which allows me to call it my own, but of course I owe thanks
to Alex for starting the discussion in the forum and posting his original inspirational code!
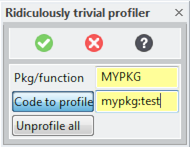
The code is now available as a Github project, see https://github.com/clausb/lisp-profiler. There is even a simple GUI
dialog on top of the low-level profiling code:
The version of the code shown above uses a SolidDesigner-specific way of getting the current time in high precision. The improved
version in the Github project should work in other Lisp dialects as well. Fingers crossed.
CoCreate Modeling: Changing the current directory during startup (02 Nov 2015)
sd-set-current-working-directory API.
But when you call this function during startup (i.e. from
code in sd_customize, or in code loaded from there), you may find that other customization code or even CoCreate Modeling itself
changes the current directory after your code runs. This is because CoCreate Modeling remembers the directory which was current
before the user closed the last session. When you restart the application, it will try to "wake up" in precisely that working directory.
To override this behavior, here's a simple trick:
- In
sd_customize(or, preferably, in code loaded from there), register an event handler for theSD-INTERACTIVE-EVENT. - This event will be fired when startup has completed and the application becomes interactive.
- In the event handler:
- Set the current working directory as you see fit
- Unregister from the event (we want one-shot behavior here)
(in-package :de.clausbrod)
(use-package :oli)

(defun interactive-event-handler(&rest r)
  (sd-set-current-working-directory (user-homedir-pathname))
  (sd-unsubscribe-event *SD-INTERACTIVE-EVENT* 'interactive-event-handler))

(sd-subscribe-event *SD-INTERACTIVE-EVENT* 'interactive-event-handler)
This particular event handler sets the current working directory to the user's home directory, but this is of course just an example for a reasonable default.
Older topics...
Add a new blog entry.to top
Edit | Attach image or document | Printable version | Raw text | Refresh | More topic actions
Revisions: | r1.104 | > | r1.103 | > | r1.102 | Total page history | Backlinks
Revisions: | r1.104 | > | r1.103 | > | r1.102 | Total page history | Backlinks
 Blog
Blog