CoCreate Modeling FAQ: Debugging Lisp code in CoCreate Modeling
 How do I activate the Lisp debugger?
By default, the Lisp debugger is disabled in release versions of CoCreate Modeling.
Instead, when a Lisp error occurs, it is reported in a "Lisp error" message box.
To enable the debugger, enter the following in the user input line:
(setf si::*enter-break-handler* t)-- ClausBrod, 21 December 2006
How do I use the Lisp debugger?
With the break handler enabled as shown above,
Lisp errors will activate the Lisp
debugger. This debugger is command-line based; it allows to list
stack backtraces, inspect local and global variables, manipulate
symbols and variables, call your own Lisp code to view data
structures et cetera. In fact, you can call any Lisp code from
the debugger prompt!
As an example, define the following function:
 (defun testfn(x y)
    (print x)
    (print foobar)
    (print y))
Load the function and run it. You will now get the usual
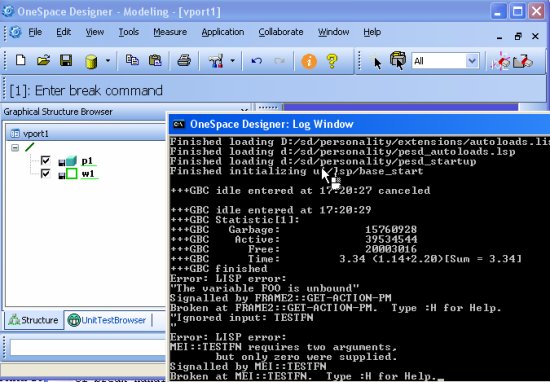
error message box. Click "OK". The prompt line now reads
[1]: Enter break commandwhich indicates that the Lisp break handler is now active. The Lisp error message from the error box is also echoed to standard output, so the console window says something like
Error: LISP error:
MEI::TESTFN requires two arguments,
       but only zero were supplied.
Signalled by MEI::TESTFN
Broken at MEI::TESTFN.  Type :H for Help.
Entering :H in the user input line results in a list of break handler commands which can be used to inspect the state of your program. The most useful of these commands are described hereafter. All debugger output is printed to the console window; all inputs are expected in the user input line. If a Lisp error occurs in compiled Lisp code, the error message issued by the break handler is often a little vague. It can help to load the original Lisp file which contains the function in question, and then to run the test again. With more source information, the Lisp error information which you get from the break handler is often a lot more precise and useful. You can enter any Lisp code directly at the debugger prompt to execute it. This allows to inspect values of variables by simply entering their name, or to call debug functions which visualize the state of the code or the current model. In addition, the debugger prompt loop understands special debugging commands:
- :h, :hh
- Show short and long versions of the break handler command list
- :m
- Print the LISP error message again.
- :c
- Show current function name
- :b, :ihs
- Show short and long versions of the invocation stack
- :hs
- Show a list of functions which can be used to access objects on the Lisp value stack anywhere in the call hierarchy.
- :lv, :l
- Shows the names of all local variables, or the names plus current values.
- :r, :q
- Resume execution
- :q
- Quit break handler, return to toploop
- :p, :n
- Move one step up or down in the invocation history stack.
How can I trace function calls?
Sometimes you only want to check if a certain function is called, or which parameters
it receives. This is the domain of the trace function:
  (defun testfn(x)
     (* 3 x))

  (trace testfn)
From now on, all calls to testfn will be logged to standard output. The log
contains both the arguments for the function call and the return value.
A typical trace log looks like this:
  1> (TESTFN 42)
  <1 (TESTFN 126)
This output indicates that the function
TESTFN was called with the parameter
x=42 and returns with a result of 126 (=3*42).
To stop tracing a function, use untrace:
(untrace testfn)-- ClausBrod - 21 Dec 2006
Can I redirect the trace output to a file?
(trace) prints to a special Lisp stream called *trace-output*.
You can open a file stream and then bind *trace-output* to that
stream; all trace output will then go to the file. Just remember to
restore the previous state of affairs when you're done.
Usually, it is more convenient to use the Common Lisp standard
command dribble to capture all Lisp input and output to a file:
(dribble "c:/temp/logfile.txt")To turn off "dribbling":
(dribble)-- ClausBrod - 21 Dec 2006
How do I set a breakpoint?
The trace macro can also be used to set breakpoints
in Lisp code. Here is a simple example:
(trace (testfn :entry (break)))Whenever someone calls testfn now, the break handler will be entered, and you can inspect the state of the program at this point. Use :r in the user input line to resume program execution. The same can be accomplished using the convenience macro
set-breakpoint which was introduced with CoCreate Modeling 2006/v14.50:
(set-breakpoint testfn)To clear the breakpoint, use
clear-breakpoint.
You can even set conditional breakpoints:
  (trace (testfn :entrycond someconditionalform :entry (break))) ;; using trace
  (set-breakpoint testfn :if someconditionalform) ;; using set-breakpoint
to top
Edit | Attach image or document | Printable version | Raw text | Refresh | More topic actions
Revisions: | r1.3 | > | r1.2 | > | r1.1 | Total page history | Backlinks
Revisions: | r1.3 | > | r1.2 | > | r1.1 | Total page history | Backlinks
OneSpaceModeling.FaqLispDebugging moved from OneSpaceModeling.OsdmFaqLispDebuggingDebugging on 02 Apr 2007 - 20:51 by ClausBrod
 CoCreateModeling